Prometheus Shard Autoscaling with Prometheus-Operator

Vertical vs Horizontal Scaling
Prometheus has become the de-facto monitoring tool in the Cloud Native era. From instances monitoring small gardens up to massive scales in the enterprise, Prometheus will handle the workload! But not without its challenges...
In big organizations with hundreds of teams, it's common to ingest millions of metrics per second. One could maintain a single Prometheus instance and solve scaling issues by throwing money at it: just get a bigger node. Well, if you are willing to pay, go for it!, but node prices usually grow at a higher pace than their sizes and there is another big difference between managing big and small Prometheus instances: WAL Replay!
Prometheus keeps an in-memory database with the most recent scraped data. To avoid data being lost during possible restarts, Prometheus keeps a Write Ahead Log(WAL) on disk. When Prometheus restarts, it will reload the WAL into memory so the most recent scraped data is available again, this operation is what we call WAL Replay.
During the WAL Replay, Prometheus is completely unavailable for queries nor is scraping any targets, so we want this operation finished as soon as possible! That's when huge Prometheus instances become a problem. When replaying hundreds of GiB of data into memory, this operation can easily take 20 to 30 minutes, or even hours in more extreme scenarios. If you decide to keep a single Prometheus instance, the WAL Replay operation can lead to a big downtime of your monitoring system.
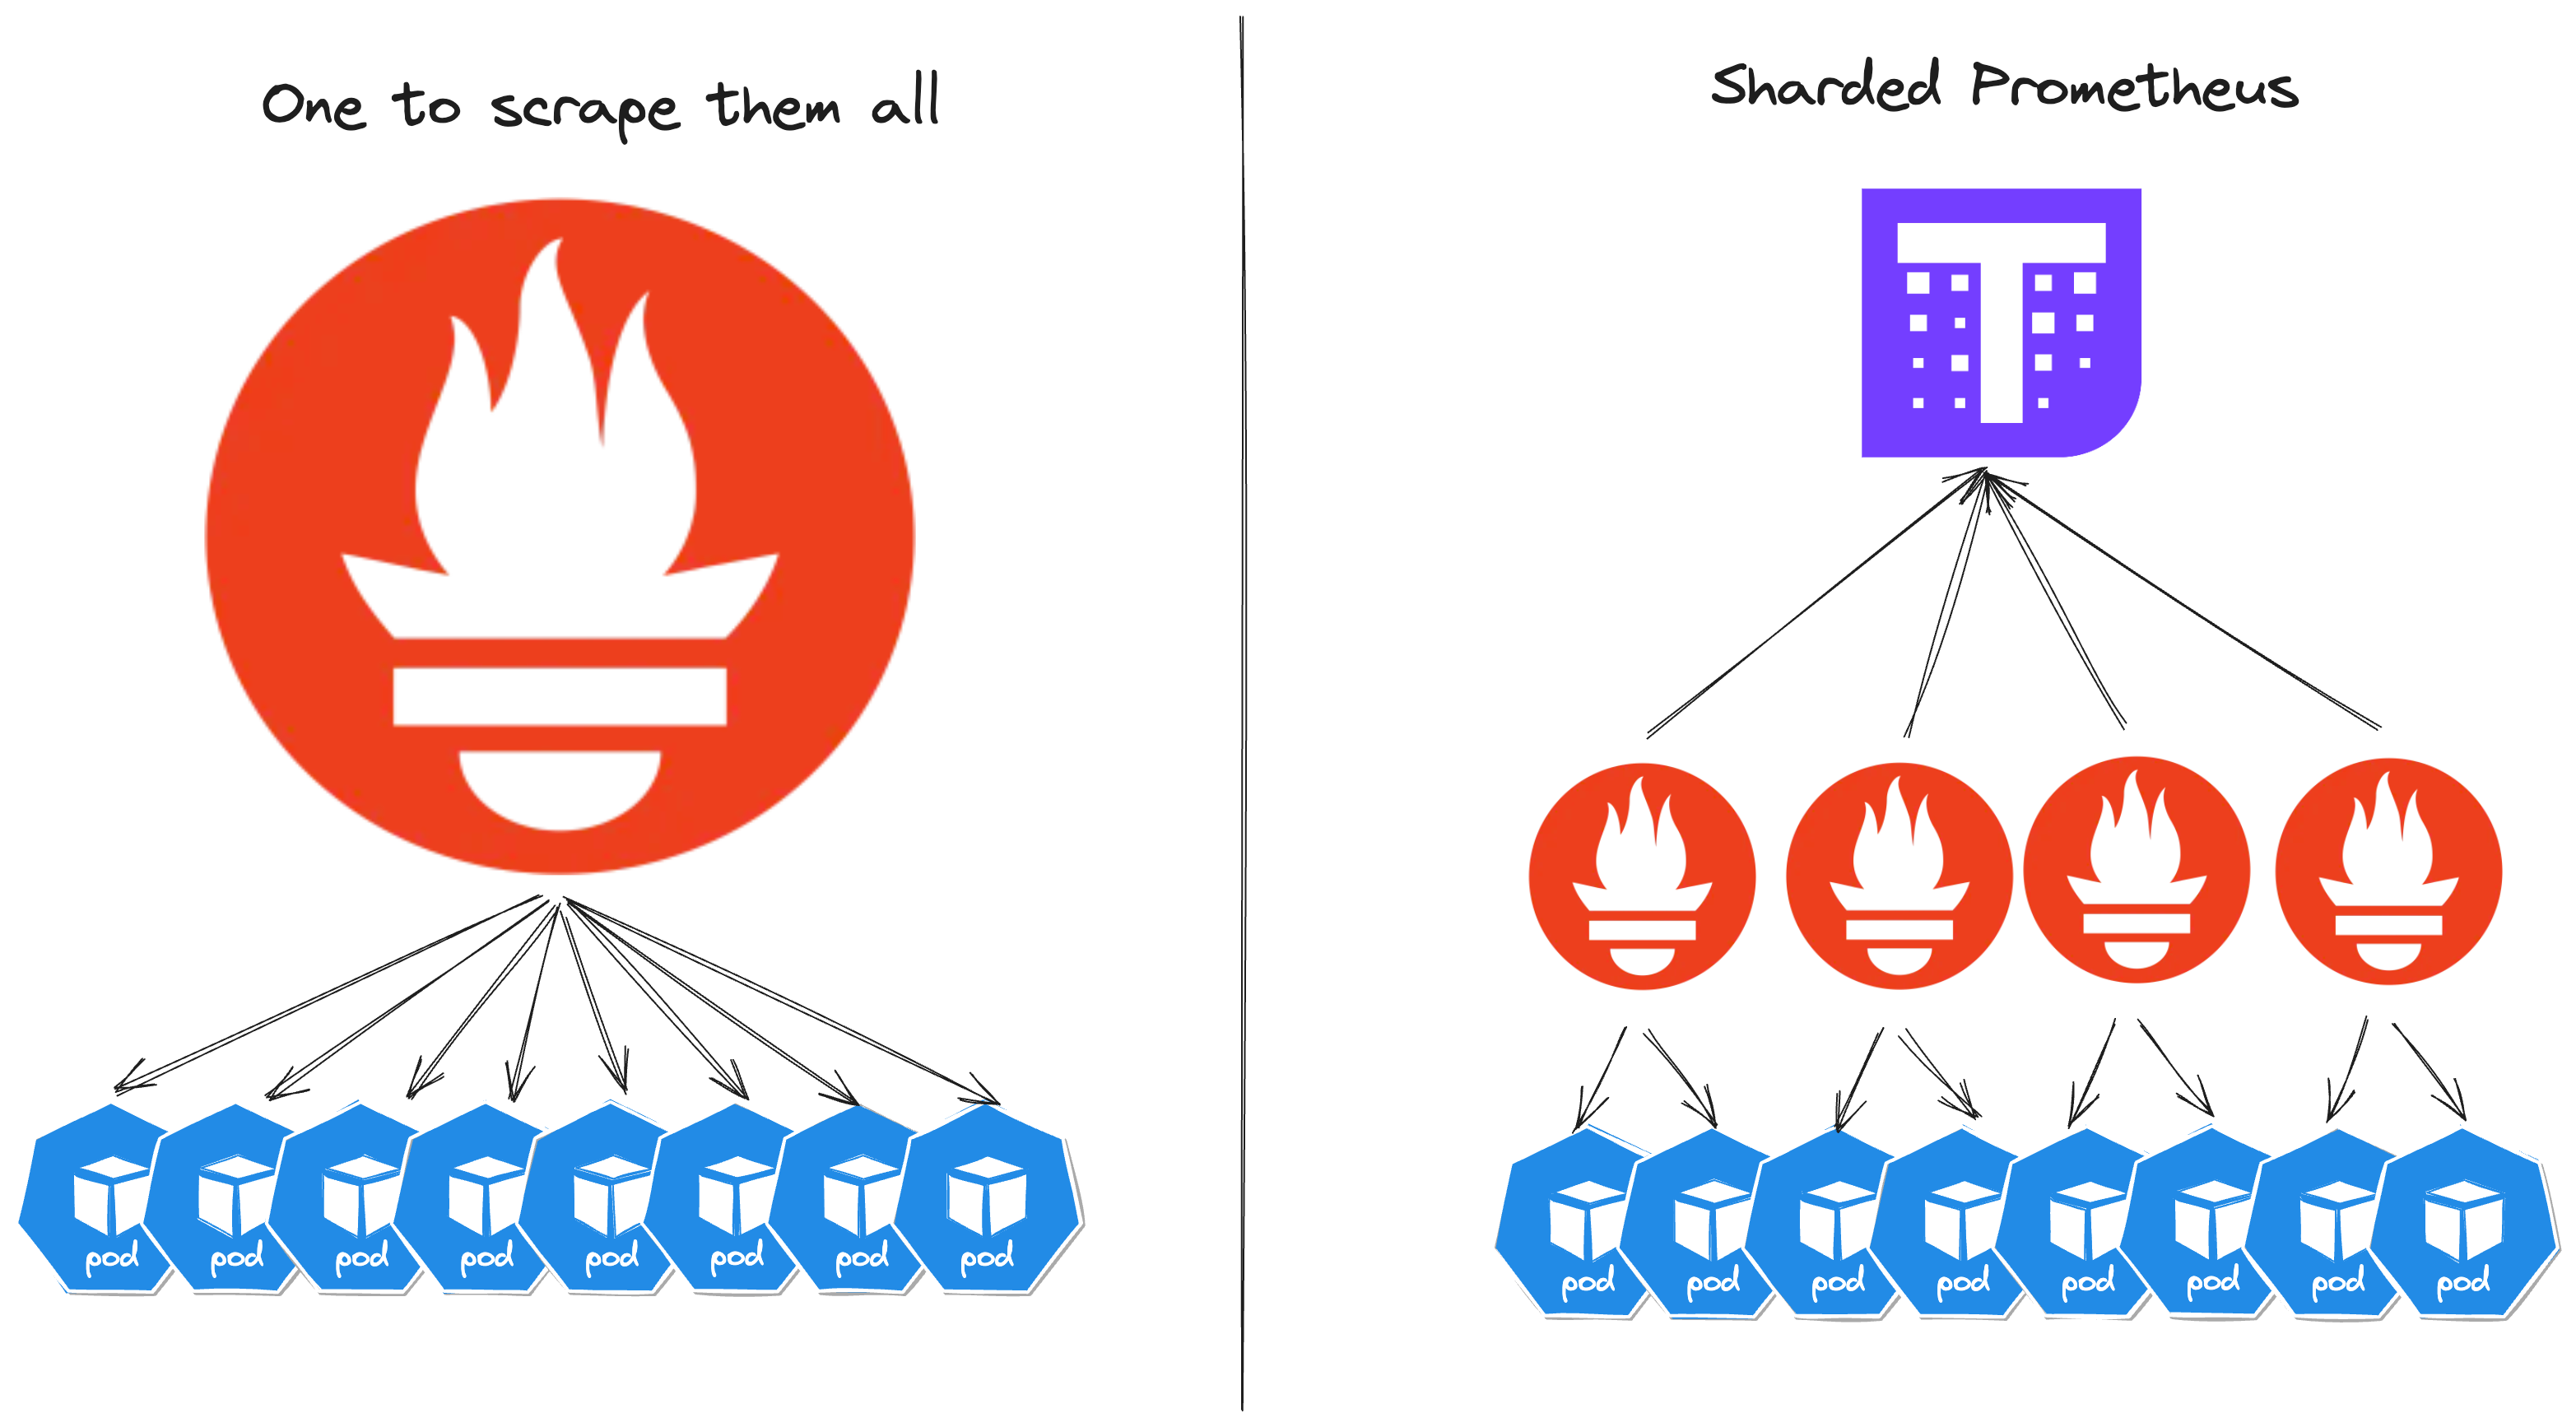
One common strategy to avoid big Prometheus instances is to shard scrape targets between multiple Prometheus. Since each Prometheus will scrape a smaller amount of metrics, they will be much smaller and WAL Replay won't be as much of a problem as before. To still be able to have a centralized querying experience, the metrics can be forwarded to another tool, like Thanos, Cortex, or a cloud provider, that is also able to scale Prometheus query capabilities.
Uneven load throughout the time
Alright, we've already made some big progress by using shards instead of scaling Prometheus vertically, but what happens when the number of exposed metrics increases and decreases throughout the day? For Kubernetes clusters that scale from hundreds of nodes to thousands every single day (and vice versa), that's a very common case. How do we find the sweet spot for the cost/benefit ratio when deciding the number of Prometheus Shards?
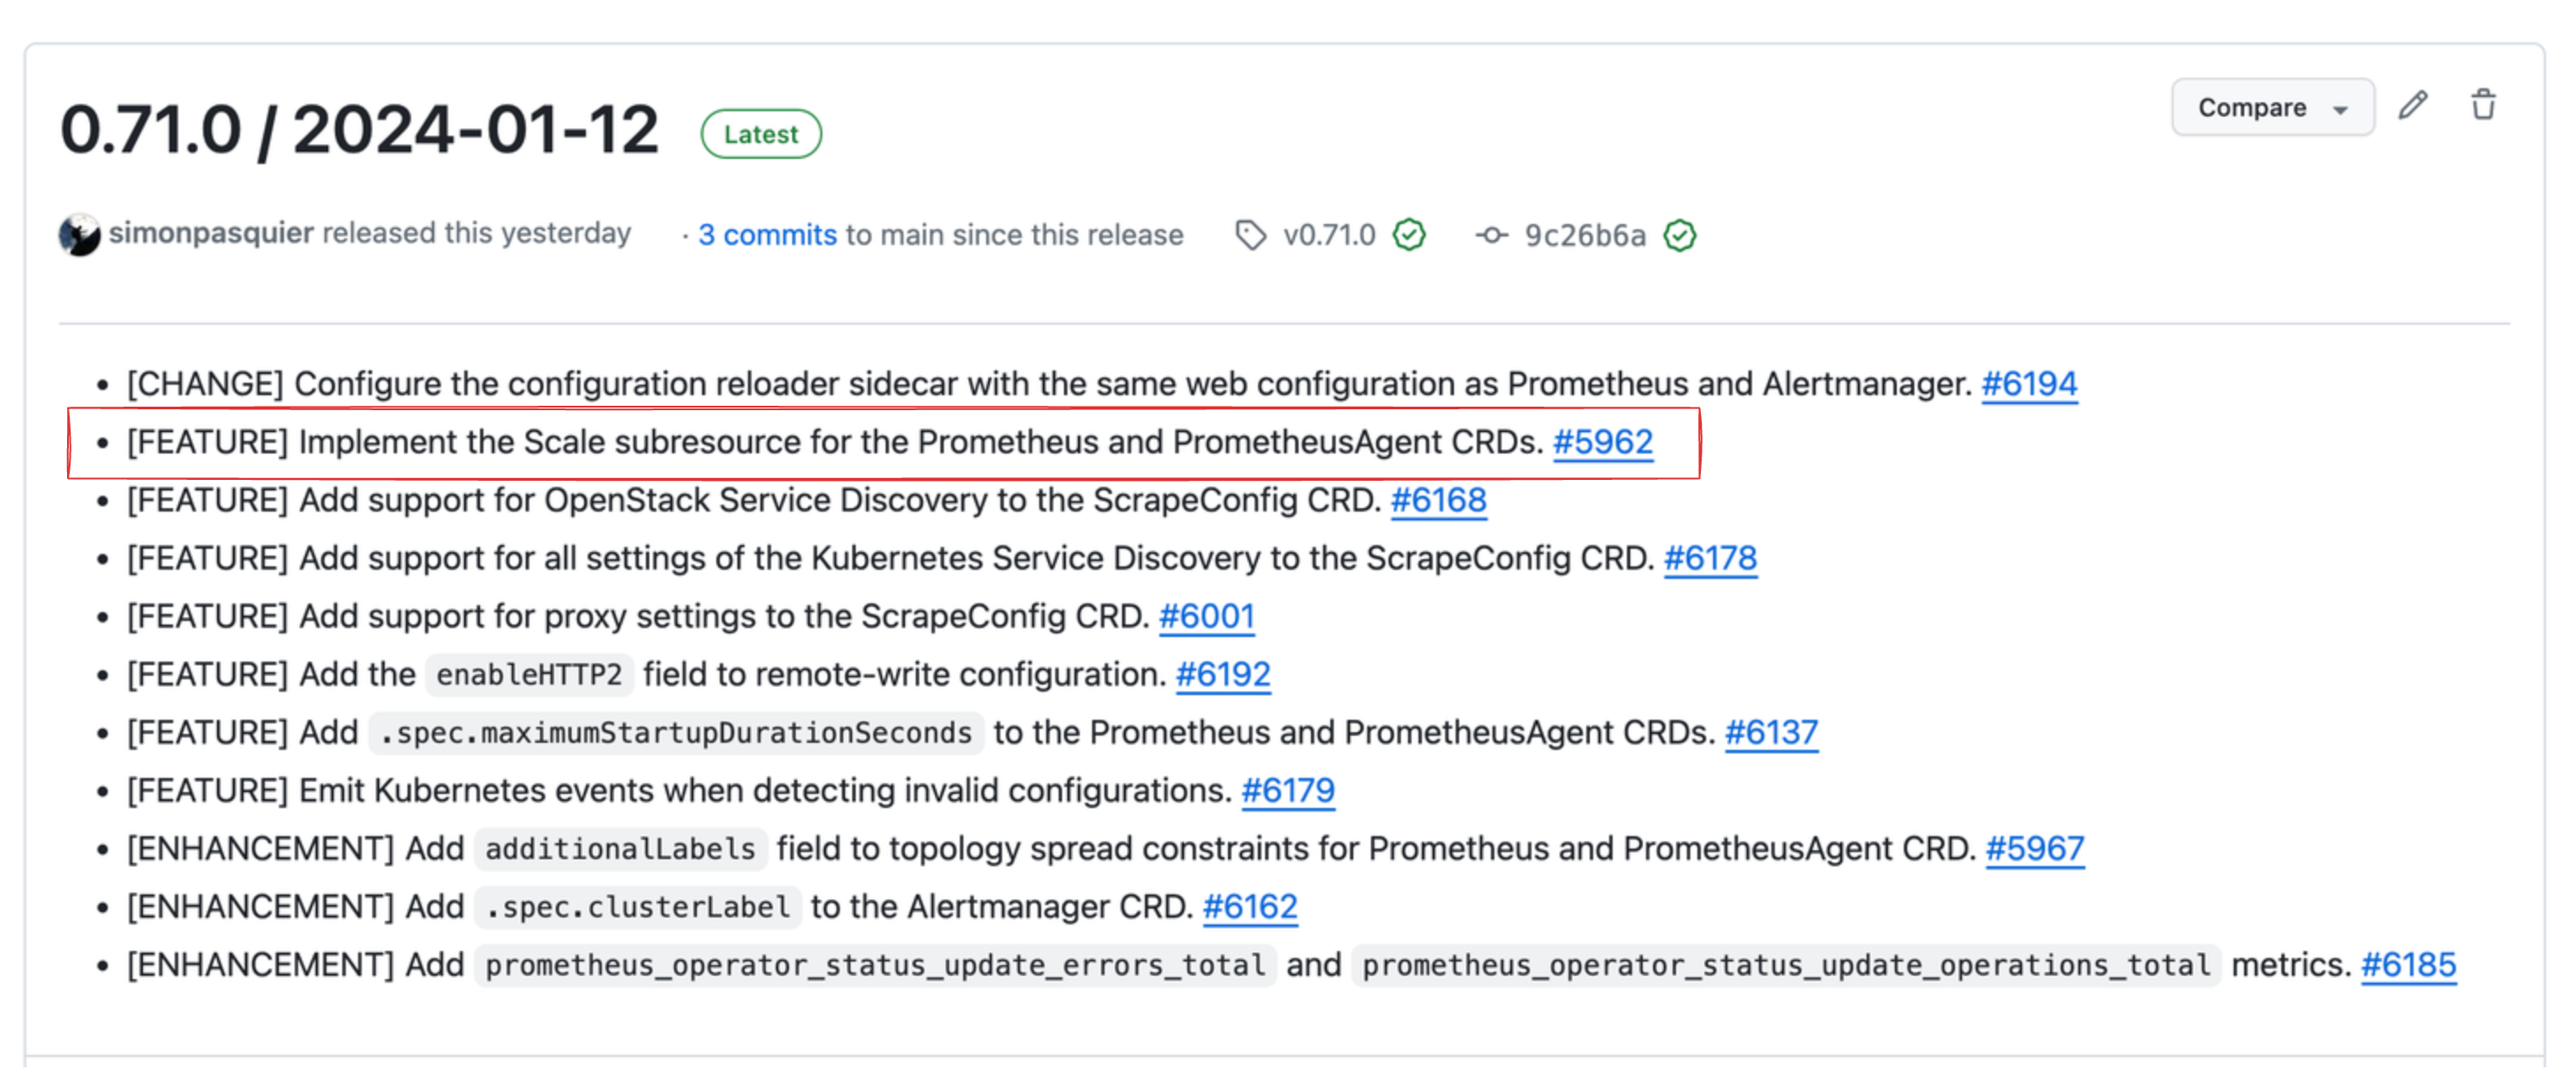
You could manually fine-tune the number of shards in your cluster every day, but there are smarter ways of doing this task. In this blog post, I'll focus on the Horizontal Pod Autoscaler strategy, which was made possible very recently with Prometheus-Operator version v0.71.0.
Autoscaling Prometheus Shards with Keda
Setup
First of all, this tutorial should work with any kind of Horizontal Pod Autoscaler that uses the Kubernetes Scale API, but for demonstration purposes will use Keda, which supports a variety of scaling strategies.
Let's start by creating a small cluster, I recommend using KinD or Minikube:
$ kind create cluster
Creating cluster "kind" ...
 ✓ Ensuring node image (kindest/node:v1.27.1) 🖼
 ✓ Preparing nodes 📦
 ✓ Writing configuration 📜
 ✓ Starting control-plane 🕹️
 ✓ Installing CNI 🔌
 ✓ Installing StorageClass 💾
Set kubectl context to "kind-kind"
You can now use your cluster with:

kubectl cluster-info --context kind-kind

Have a nice day! 👋
Now let's install Keda:
helm repo add kedacore https://kedacore.github.io/charts
helm repo update
helm install keda kedacore/keda --namespace keda --create-namespace
watch kubectl get pods -n keda
Once all pods get to the Running status, we can proceed!
The next step is installing Prometheus Operator:
git clone https://github.com/prometheus-operator/prometheus-operator
cd prometheus-operator
kubectl apply --server-side -f bundle.yaml
Deploy Prometheus and an example application
Alrighty, the initial setup is complete. Let's deploy some apps exposing a few metrics! For demonstration purposes, let's deploy an Alertmanager:
---
apiVersion: monitoring.coreos.com/v1
kind: Alertmanager
metadata:
  name: main
  namespace: monitoring
spec:
  image: quay.io/prometheus/alertmanager:v0.26.0
  podMetadata:
    labels:
      app.kubernetes.io/instance: main
      app.kubernetes.io/name: alertmanager
  replicas: 1
  serviceAccountName: alertmanager-main
---
apiVersion: v1
kind: Service
metadata:
  name: alertmanager-main
  namespace: monitoring
  labels:
    app.kubernetes.io/instance: main
    app.kubernetes.io/name: alertmanager
spec:
  ports:
  - name: web
    port: 9093
    targetPort: web
  - name: reloader-web
    port: 8080
    targetPort: reloader-web
  selector:
    app.kubernetes.io/instance: main
    app.kubernetes.io/name: alertmanager
---
apiVersion: v1
automountServiceAccountToken: false
kind: ServiceAccount
metadata:
  name: alertmanager-main
  namespace: monitoring
---
apiVersion: monitoring.coreos.com/v1
kind: ServiceMonitor
metadata:
  name: alertmanager-main
  namespace: monitoring
spec:
  endpoints:
  - interval: 30s
    port: web
  - interval: 30s
    port: reloader-web
  selector:
    matchLabels:
      app.kubernetes.io/instance: main
      app.kubernetes.io/name: alertmanager
And also a Prometheus responsible for scraping this Alertmanager (and more that will deploy afterward). We want to scale based on scraped samples per second, so we'll configure Prometheus to scrape itself
apiVersion: monitoring.coreos.com/v1
kind: Prometheus
metadata:
  name: k8s
spec:
  image: quay.io/prometheus/prometheus:v2.48.1
  podMetadata:
    labels:
      app.kubernetes.io/instance: k8s
      app.kubernetes.io/name: prometheus
  shards: 1
  serviceAccountName: prometheus-k8s
  serviceMonitorSelector: {}
---
apiVersion: rbac.authorization.k8s.io/v1
kind: ClusterRole
metadata:
  name: prometheus-k8s
rules:
- apiGroups:
  - ""
  resources:
  - configmaps
  verbs:
  - get
- apiGroups:
  - ""
  resources:
  - services
  - endpoints
  - pods
  verbs:
  - get
  - list
  - watch
- apiGroups:
  - extensions
  resources:
  - ingresses
  verbs:
  - get
  - list
  - watch
- apiGroups:
  - networking.k8s.io
  resources:
  - ingresses
  verbs:
  - get
  - list
  - watch
---
apiVersion: rbac.authorization.k8s.io/v1
kind: ClusterRoleBinding
metadata:
  name: prometheus-k8s
roleRef:
  apiGroup: rbac.authorization.k8s.io
  kind: ClusterRole
  name: prometheus-k8s
subjects:
- kind: ServiceAccount
  name: prometheus-k8s
  namespace: default
---
apiVersion: v1
kind: Service
metadata:
  name: prometheus-k8s
  labels:
    app.kubernetes.io/instance: k8s
    app.kubernetes.io/name: prometheus
spec:
  ports:
  - name: web
    port: 9090
    targetPort: web
  - name: reloader-web
    port: 8080
    targetPort: reloader-web
  selector:
    app.kubernetes.io/instance: k8s
    app.kubernetes.io/name: prometheus
---
apiVersion: v1
automountServiceAccountToken: true
kind: ServiceAccount
metadata:
  name: prometheus-k8s
---
apiVersion: monitoring.coreos.com/v1
kind: ServiceMonitor
metadata:
  name: prometheus-k8s
spec:
  endpoints:
  - interval: 30s
    port: web
  - interval: 30s
    port: reloader-web
  selector:
    matchLabels:
      app.kubernetes.io/instance: k8s
      app.kubernetes.io/name: prometheus
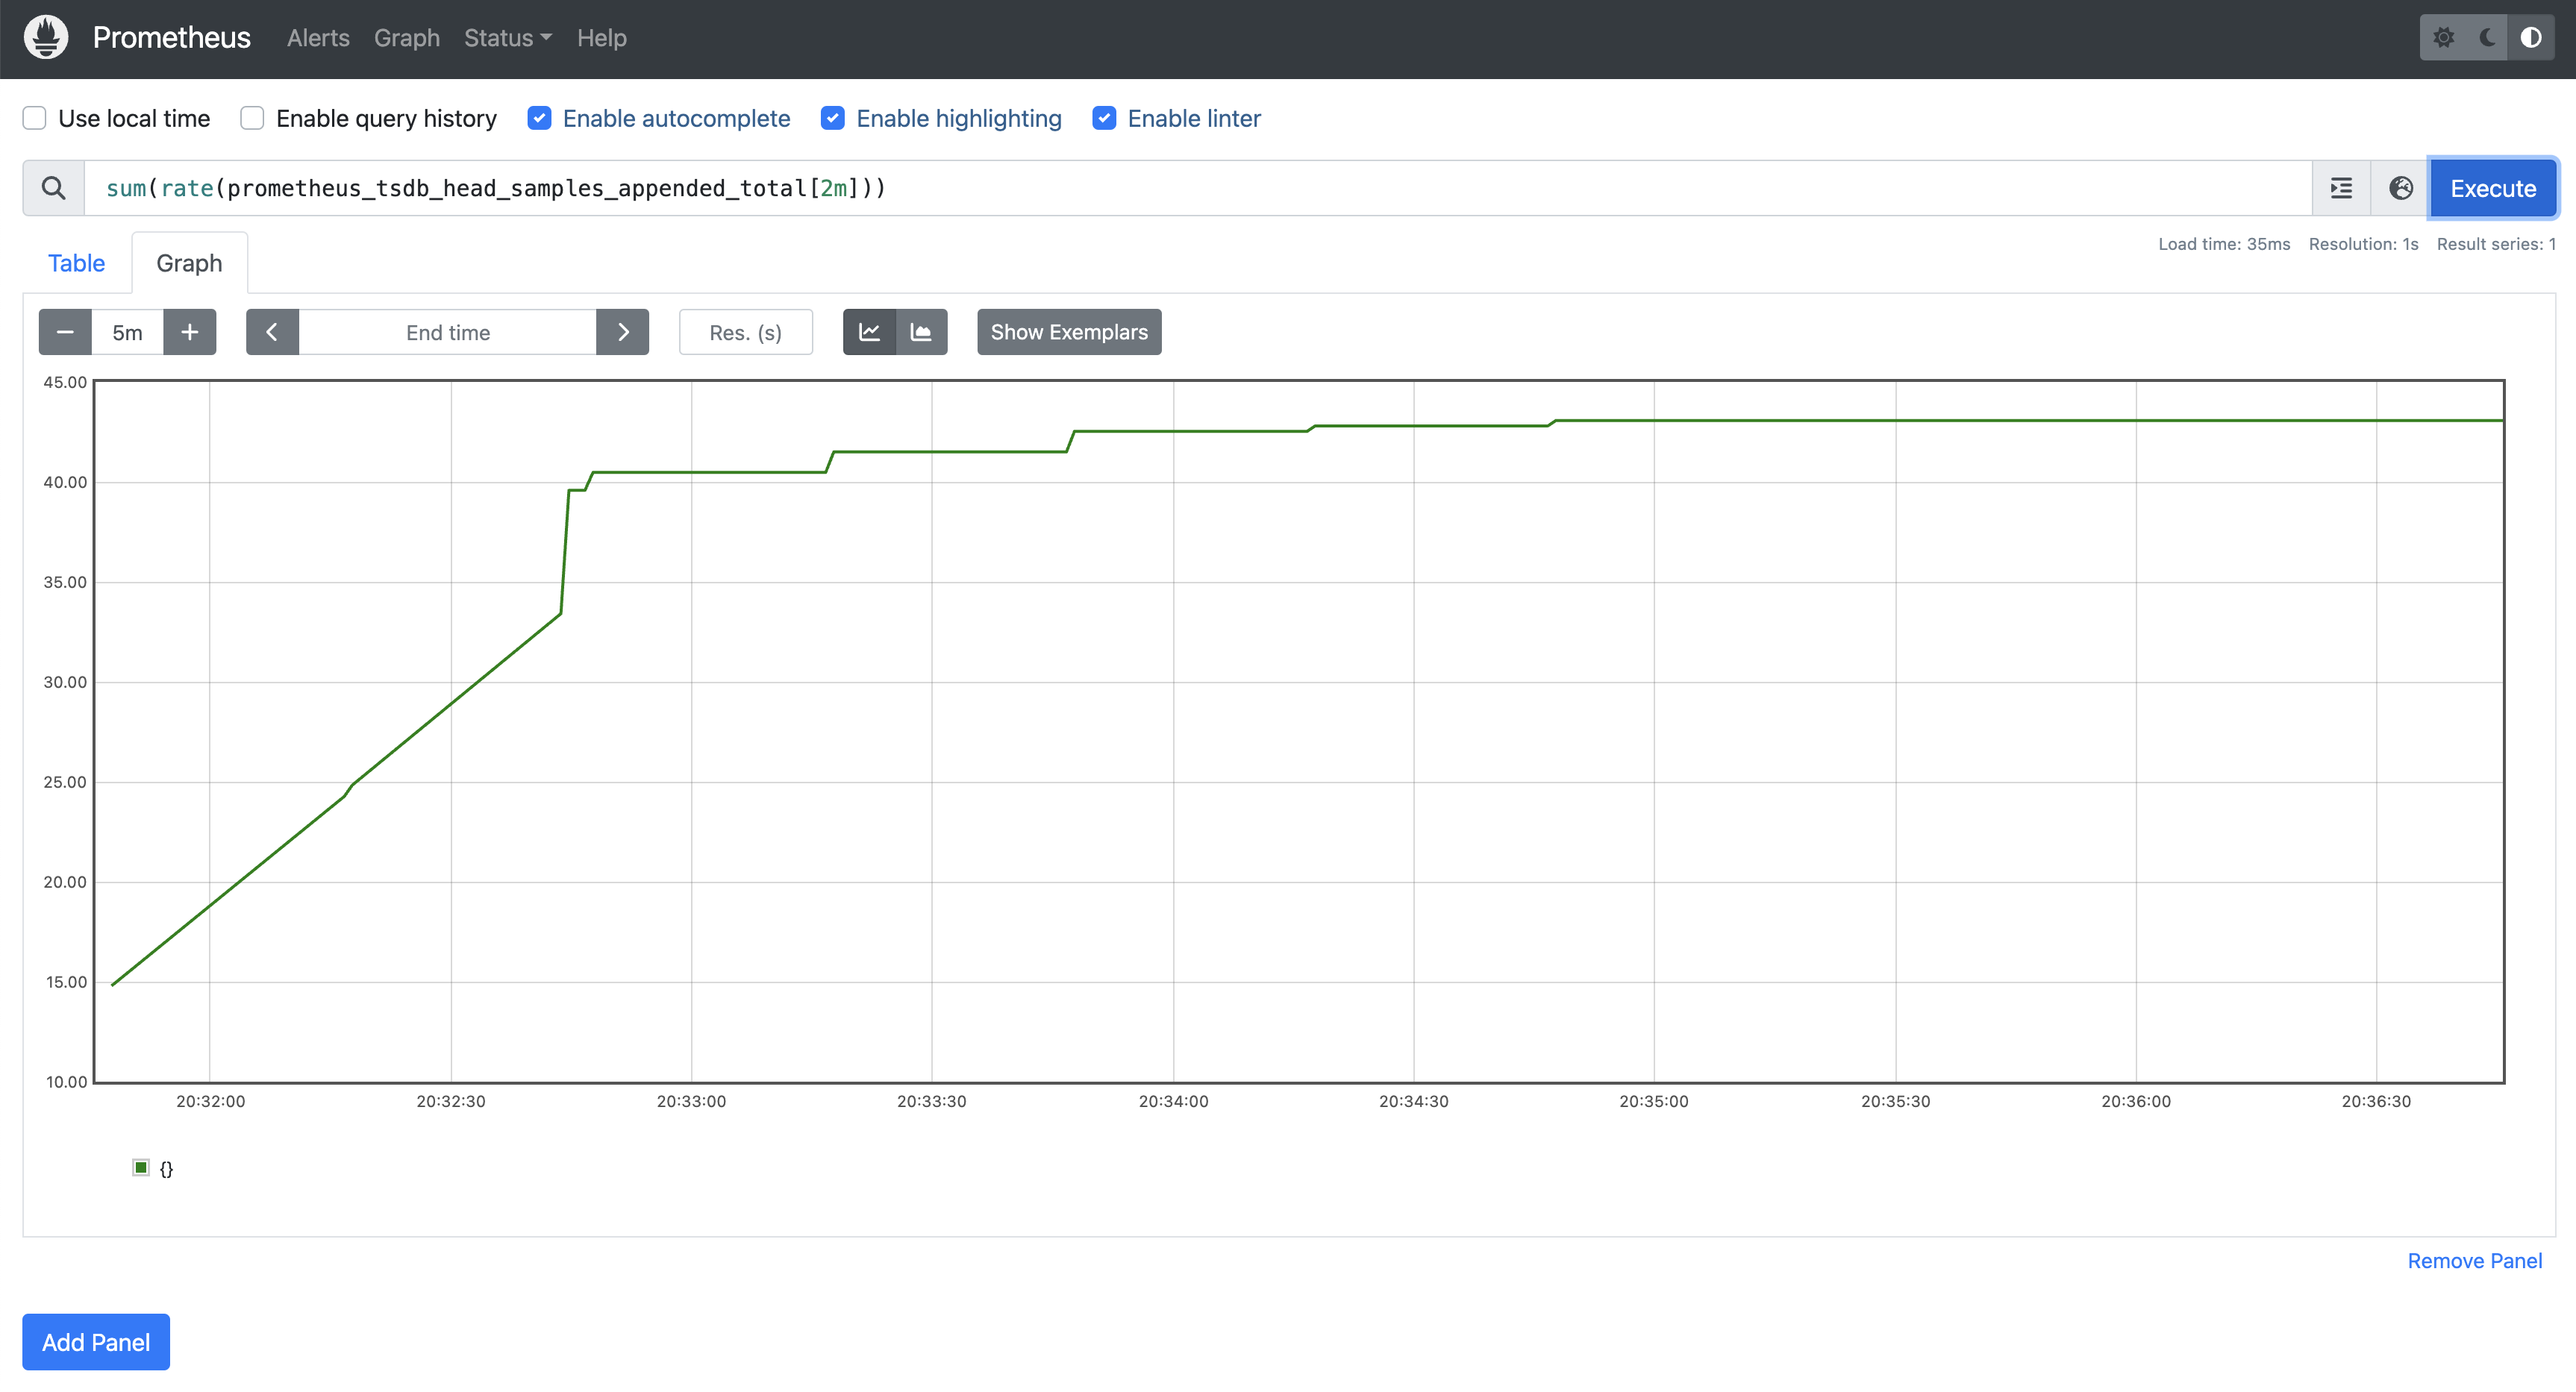
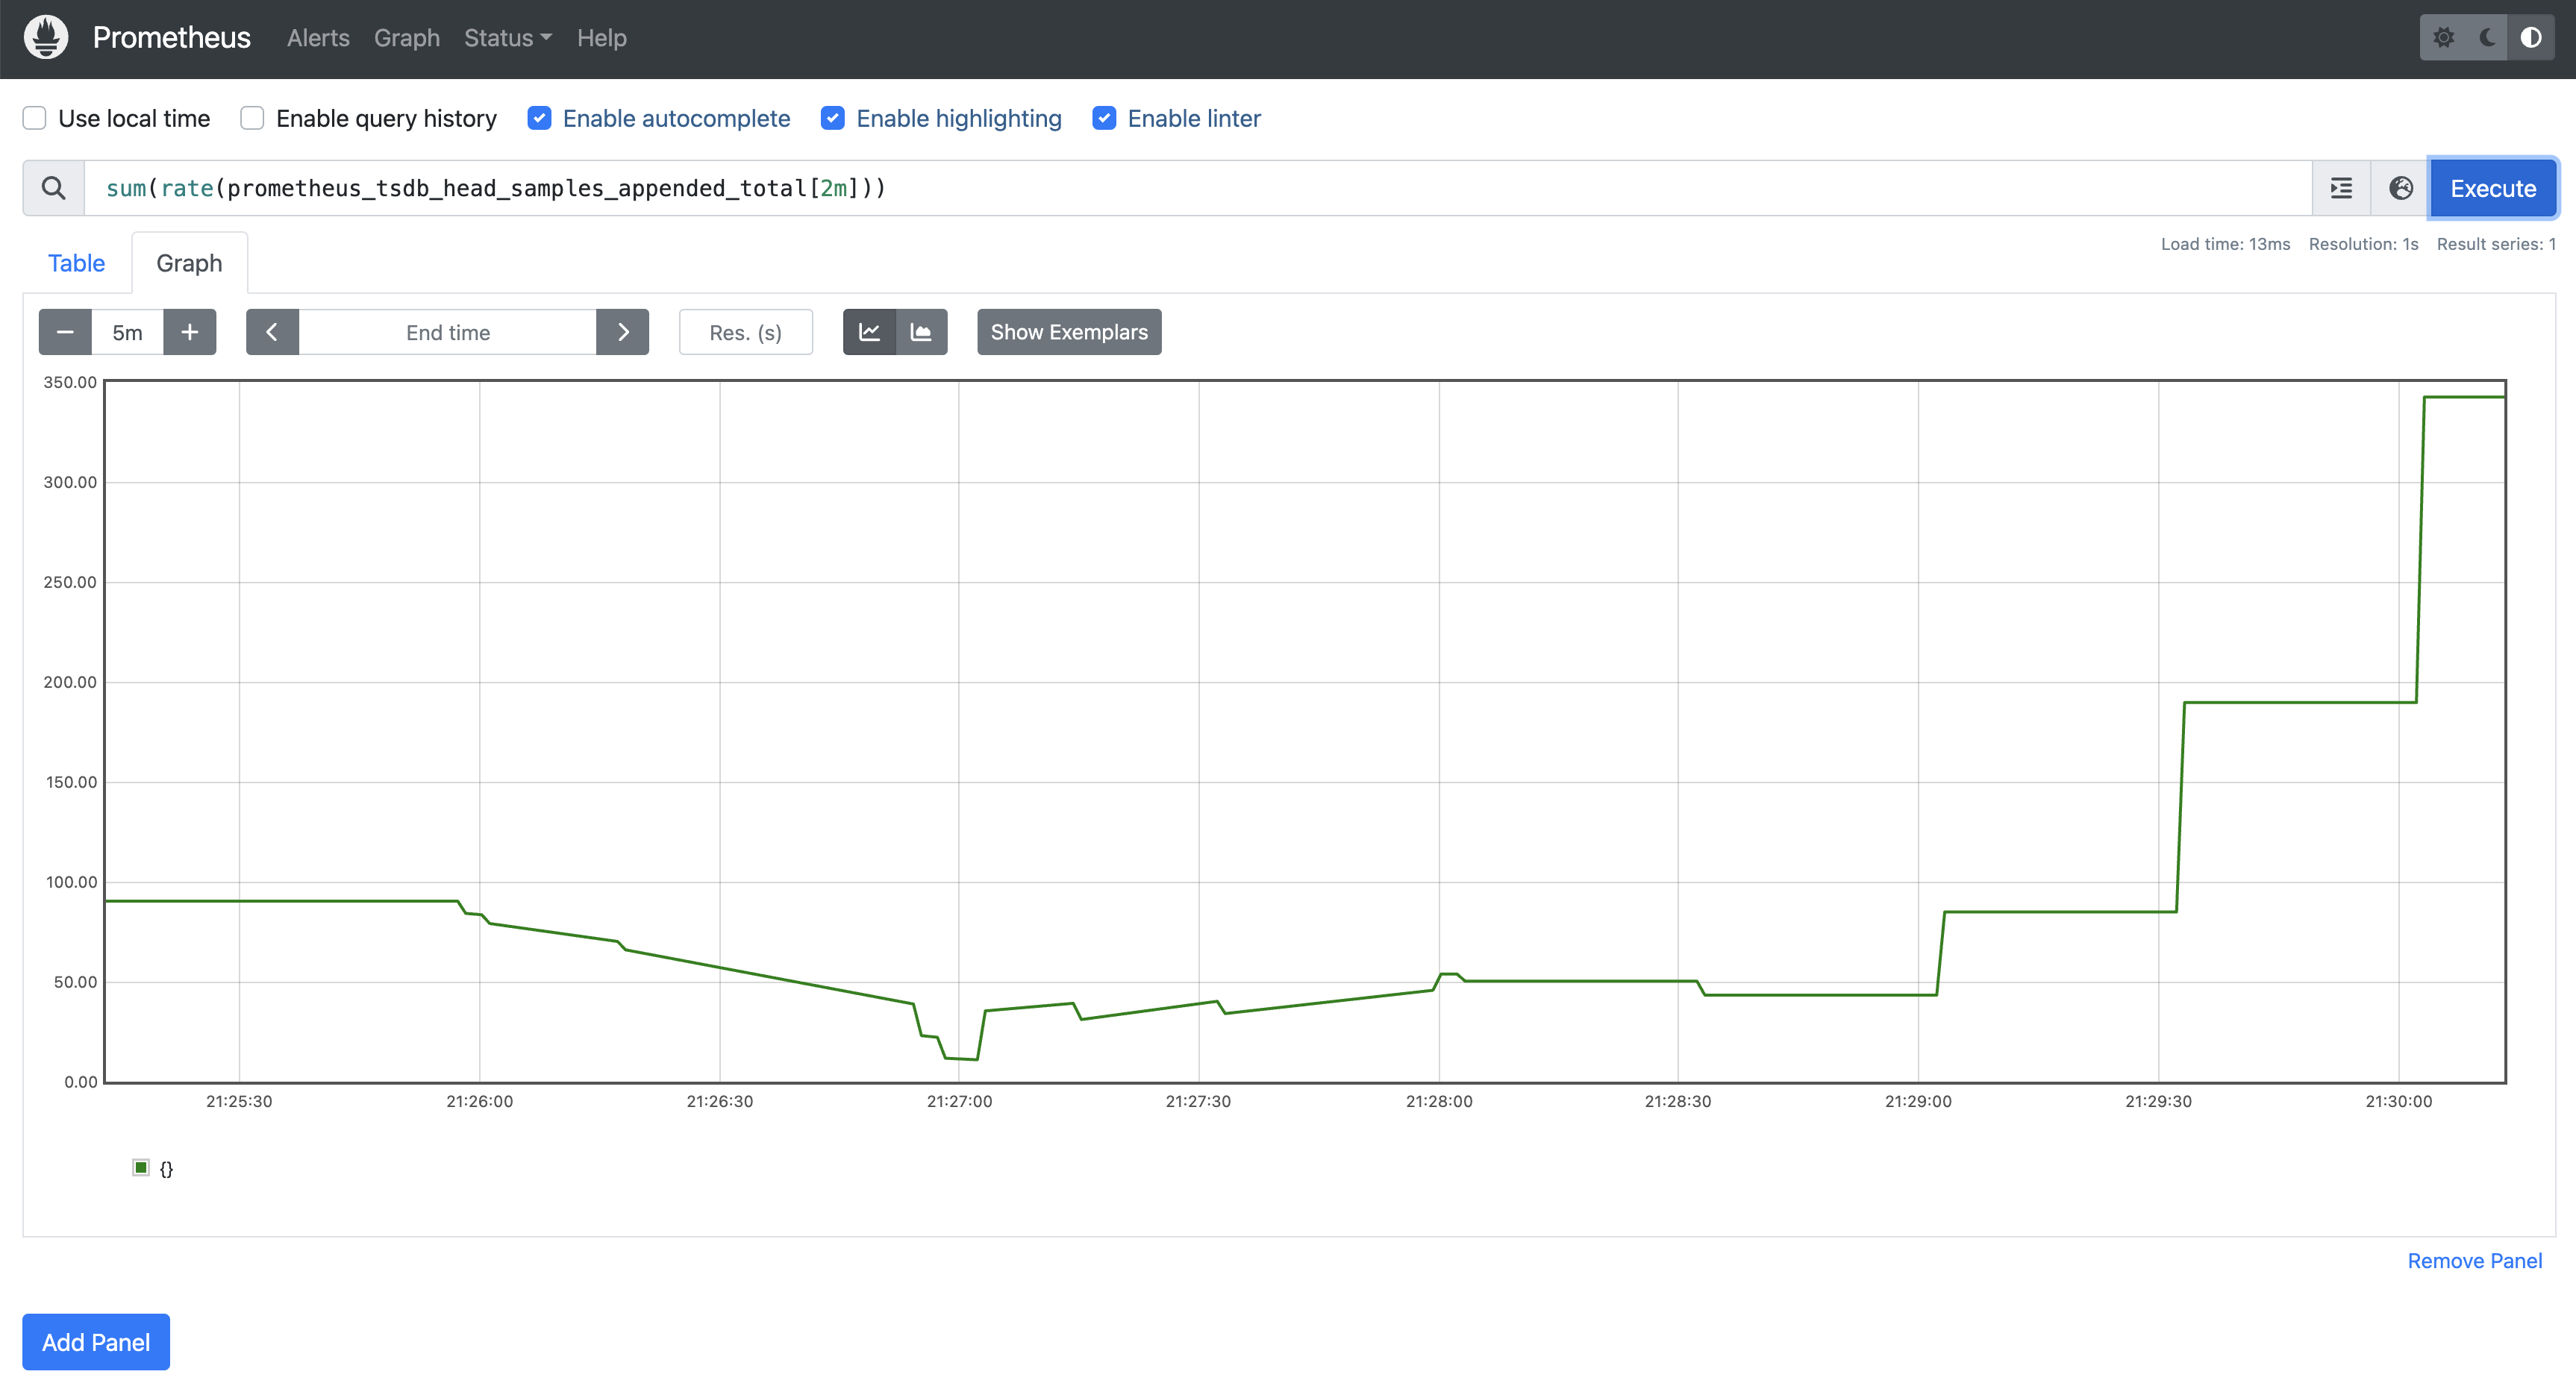
After deploying everything, we can verify how Prometheus is doing by exposing it's UI:
kubectl port-forward prometheus-k8s-0 9090
If we query the metric sum(rate(prometheus_tsdb_head_samples_appended_total[2m])), we'll notice that we stabilize at around 40~50 samples ingested per second.
Configure Keda to scale up/down Prometheus
Autoscaling objects with Keda are configured through the ScaledObject CRD. ScaledObjects has a pletora of different scalers, but here we'll use Prometheus scaler to scale Prometheus itself.
apiVersion: keda.sh/v1alpha1
kind: ScaledObject
metadata:
  name: prometheus
spec:
  scaleTargetRef:
    apiVersion: monitoring.coreos.com/v1
    kind: Prometheus
    name: k8s
  minReplicaCount:  1
  maxReplicaCount:  100
  fallback:
    failureThreshold: 5
    replicas: 10
  triggers:
  - type: prometheus
    metadata:
      serverAddress: http://prometheus-k8s.svc.default.cluster.local:9090
      # Ingested samples per second across all shards
      query: sum(rate(prometheus_tsdb_head_samples_appended_total[2m]))
      # We'll scale up/down on every 200 samples ingested per second
      threshold: '200'
To verify the ScaledObject is working as expected, run:
kubectl get scaledobject prometheus
You should see that STATUS and ACTIVE should both be True.
Triggering scale ups!!!
Now let's get to the fun part, start by increasing the number of Alertmanager pods:
kubectl patch alertmanager main -p '{"spec": {"replicas": 20}}' --type merge
When checking the Prometheus UI, we'll notice a rapid increase in ingested samples:
If we check the number of Prometheus pods, we'll notice that new shards are being deployed:
$ kubectl get pods -l app.kubernetes.io/name=prometheus
NAME                       READY   STATUS    RESTARTS   AGE
prometheus-k8s-0           2/2     Running   0          21m
prometheus-k8s-shard-1-0   2/2     Running   0          2m54s
prometheus-k8s-shard-2-0   2/2     Running   0          2m24s
prometheus-k8s-shard-3-0   1/2     Running   0          54s
Let's also verify that Prometheus pods are scaled down if the load decreases
kubectl patch alertmanager main -p '{"spec": {"replicas": 1}}' --type merge
After a few minutes, the shards will return smaller numbers of ingested samples and Keda should adjust the number of shards again:
$ kubectl get pods -l app.kubernetes.io/name=prometheus
NAME               READY   STATUS    RESTARTS   AGE
prometheus-k8s-0   2/2     Running   0          30m